Analysis of Bottomland Hardwood Areas and Assessment of Wildlife Habitat Quality at the Potential Future Waters Bluff Reservoir Site
Final Report to Texas Water Development Board for the fulfillment of interagency
agreement No. 97-483-226
Texas Parks & Wildlife Department, Austin, Texas, April 1998
Part 1
Analysis of Bottomland Areas and Classification of Land Cover Types
Principal Investigators: Changxiang Liu, Ph.D., Christine Coats, Jason Singhurst, and A. Kim Ludeke, Ph.D. GIS Lab, Texas Parks & Wildlife Department
Introduction
Bottomland hardwood areas are considered among the most important habitats for wildlife. In these areas, forests, swamps, ponds, and meandering channels provide not only various habitats needed by a variety of fish and wildlife species and migrating birds, but also contain resources necessary for their survival. These areas are also rich in plant and animal species diversity. Bottomland hardwood forests play an important role in controlling soil erosion, maintaining water quality, recharging groundwater, and preventing flood damage. On the other hand, the bottomland hardwood areas are primary locations for economic development. Hardwood trees, fertile soils, water resources, and unique landscape attract many kinds of development activities, such as agriculture, forestry, tourism, industry, and water development. As a consequence, bottomland hardwood forests have been disappearing rapidly since the turn of this century in Texas as well as throughout the nation.
As human population increases, demand for water supply in urban areas, by agriculture, and industries rises dramatically. In Texas, periodic droughts have made the water supply very critical for the economic development and sustainability of the state, hence the driving force for more water development projects. Unavoidably, there are always losses associated with every water resources development project. One of those losses is the loss of bottomland hardwood areas and wildlife habitats. Federal and state laws mandate that an assessment of negative impacts and mitigation be made before any projects can take place.
This part of the project is to study the direct impact of the proposed Waters Bluff reservoir on bottomland hardwood areas at the proposed reservoir site and provides the Texas Water Development Board (TWDB) with essential data on the types and acreage of bottomland forests subject to inundation.
The land cover types identified in this study are based solely on remotely sensed data (TM imagery and aerial photography) and field survey at the study site. No soil or hydrological data were collected and used in the determination of the land cover types as would be required in a federal delineation of forested wetlands in the bottomland hardwood areas. Some portions of the bottomland hardwood forest, as defined in this study, and other land cover types identified here may occupy the same areas as federally delineated bottomland hardwood forested wetlands. However, the land cover units presented in this report do not substitute for a federal jurisdictional wetland delineation to determine wetland areas for which mitigation may be required.
Study Area
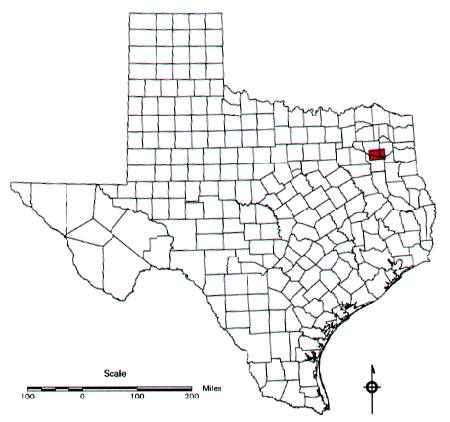
The proposed Waters Bluff reservoir site is located between Smith, Upshur, and Wood counties along the Sabine River in northeastern Texas (Map 1). Most of the area falls in the pineywood region of eastern Texas, even though post oak savanna appears occasionally in the western part of the study area.
Shortleaf pine (Pinus echinata Mill.), loblolly pine (Pinus taeda L.), and other oak and hardwood species dominate forest communities in the uplands and on hill slopes. The bottomland areas and floodplains are mainly made up of bottomland hardwood species typical to east and southeast Texas. Other common tree species in the study area include eastern red cedar (Juniperus virginiana L.), post oak (Q. stellata Wangenh.), black hickory (Carya texana Buckl.), sweetgum (Liquidambar styraciflua L.), water oak (Q. nigra L.), southern red oak (Q. falcata Michx.), blackgum (Nyssa sylvatica Marsh.), blackjack oak (Q. marilandica Muenchh.), willow oak (Q. phellos L.), basket oak (Q. michauxii Nutt.), overcup oak (Q. lyrata Walt.), river birch (Betula nigra L.), red maple (Acer rubrum L.), green ash (Fraxinus pennsylvanica Marsh.), and American elm (Ulmus americana L.). Almost all the vegetation types in the area have been subjected to various human disturbances in the past (i.e. logging). Most of the area was logged or selectively logged at least once.
We used one LandSat Thematic Mapper (TM) satellite imagery scene (path 25 and row 37), which was obtained from the Corps of Engineers, as the primary source for the land cover classification. The TM scene was originally acquired by the Earth Resources Observation Satellite Company (EROS) in September 1994. It contains 6-band data (the thermal band 6 was removed) in Universal Transverse Mercator (UTM) projection (zone 15 and datum NAD27) with a spatial resolution of 25 meters. We also purchased recent National Aerial Photograph Program (NAPP) color infrared (CIR) aerial photographs of the study area for photointerpetation and ground truthing. Reservoir normal elevation lines (300 ft. above sea level) were drawn and bottomland hardwood areas were delineated on USGS 7.5' quadrangle paper maps after a field reconnaissance. These maps were scanned and lines were vectorized to create vector coverages. The road network is based on digital county road maps by Texas Department of Transportation (TXDOT). Texas Water Development Board (TWDB) provided dam locations, reservoir pool elevation and layout drawings. Data processing, classification, and analysis were performed by using ERDAS Imagine (ERDAS Inc. 1997) and ARC/INFO (ESRI 1996).
The 6-band TM image was first subjected to a principal component analysis (PCA) then a unsupervised classification. Three bands or principal component axes were extracted from the 6-band data, but retain most of the variance of the original data. The PCA processed image and CIR aerial photographs were used as the primary source for the supervised classification. In the unsupervised classification, 150 classes were obtained from the 6-band TM image.
Training samples were collected from one field reconnaissance trip to the study area in August 1997. About 100 sample points were taken in the field with additional land cover sample areas marked on aerial photographs for photointerpetation and supervised classification. We paid special attention to the ecotones between upland and bottomland types and delineation was mostly based on the field experience and changes in contour lines. We did recognize more types than we actually can identify on the TM image. Some cover types do not yield distinguishable signatures on the TM imagery. Therefore, some of the field recognized land cover types had to be combined into other types to form a composite type, such as grassland/crops and willow-birch-water elm types.
After the field trip, the 150 classes from the unsupervised procedure were subjected to a supervised classification by using training samples, the PCA processed image, and topography (contours), and by interpreting CIR aerial photographs. A total of nine types were recognized in the process.
The area of each land cover type within the inundation level of the reservoir was calculated by superimposing and masking the classified image upon a raster layer created from 300 ft. contour line (normal conservation pool level) drawn on the USGS maps.
The ground truthing was conducted in September 1997. We chose to sample land parcels of at least 4x4 pixels, i.e. 1 hectare to assure the point would not fall out of the parcel. About 250 valid GPS points were collected during the trip. Since most of the area was privately owned and inaccessible by field crew, the collection of ground truthing points was largely restricted to the road side. Therefore, it cannot be regarded as a random sampling. Caution must be exercised in interpreting the results of the accuracy matrix. However, the procedure is necessary for in-situ verification of the classified land cover types. Another thing we have to point out is that the TM image was acquired in 1994 and does not reflect the changes thereafter. Recent logging in several areas within the reservoir area has been noticed (Frye, personal communication). Therefore, the loss of each land cover type in the bottomland areas reported here may be somewhat overestimated.
Results
1. Description of Major Land Cover Types
Nine land cover types have been recognized in the study area. Water and bare ground/soil are considered not vegetative types, although they may have sparse or partial vegetation cover. These nine types are grassland/crops, pure pine/pine plantation, oak-hickory forest, pine-oak forest, hardwood-pine forest, bottomland hardwood forest, willow-birch-water elm forest, water, and bare ground/soil.
We describe each of these vegetation types briefly:
- Pure Pine/Pine Plantation
- This vegetation type is dominated primarily by loblolly pine and shortleaf pine singly or in combination, at least in the overstory. In some cases, it may be planted slash pine stands or eastern red cedar in limited areas. Stand ages and density vary greatly from place to place. This vegetation type can be found in a variety of habitats except in the wettest areas. Species abundance in the understory depends on the intensity of management and the age of the stands. Southern red oak, sweetgum, water oak, dogwood, and other hardwood species can coexist. This vegetation type is a direct result of silvicultural practices, whereas cedar groves usually develop on abandoned agricultural fields. The latter can only be found in limited areas.
- Oak-Hickory Forest
- Species commonly found in this type are post oak, black hickory, blackjack oak, and winged elm (Ulmus alata Michx.). Other associate species include southern red oak, sweetgum, dogwood (Cornus florida L.), bluejack oak (Q. incana Bartr.), and eastern red cedar (Juniperus virginiana L.). Sassafras, farkleberry (Vaccinium arboreum Mars. Var. arboreum), blackhaw (Viburnum rufidulum Raf.), yaupon (Ilex vomitoria Ait.), American beautyberry (Carllicarpa americana L. ) and aromatic sumac (Rhus aromatica Ait. ) are the common shrub species. Common grasses include splitbeard bluestem (Andropogon ternarius Michx), sessile flowered chasmanthium (Chosmanthium sessiliflorum (Poir.) Yates), little bluestem (Schizachyrium scoparium), and Indiangrass (Sorghastrum nutans (L.) Nash or S. elliottii (Mohr.) Nash). Soils are excessively-drained, poor in nutrients, and sandy on the ridges and hill tops. The herbaceous cover is sparse owing to dry conditions. This type can also be the result of removing of pines by selective logging.
- Pine-Oak Forest
- This is a upland type dominated by pines (shortleaf and loblolly) with oaks (post oak, blackjack oak, southern red oak) and hickory as the codominants. Site conditions and associated shrub and herbaceous species are similar to that of the oak-hickory forest type.
- Hardwood-Pine Forest
- This type is a mixture of hardwood species and a few pines (shortleaf and loblolly
pines) growing in the floodplain and wet areas. The habitat is similar
to that of the bottomland hardwood forest type. The overstory of this type
is predominantly made up of hardwood trees, with scattered pines. This
type commonly occurs on better drained bottomland soils within the floodplain
including old levees, flats, and higher terraces. These areas are correlated
with Zone V, of the classification system developed by the National Wetlands
Technical Council (Larson et al. 1981).
Common hardwood species are water oak, sweetgum, blackgum, willow oak, white oak, sugar maple (Acer saccharum Marsh), hawthornes (Crataegus spp.), buckthorn (Rhamnus caroliniana Walt.). Common grasses are splitbeard bluestem, sessile chasmanthium, and little bluestem. Presence of pines is minimal, and in some areas it is a result of plantation. This type was included as a bottomland hardwood and associated wetland community type 3, Forested Wetland (Palustrine) by the US Fish and Wildlife Service (1985) in an inventory of bottomland hardwood forest types in Texas. Therefore, we do consider this type a bottomland forest. - Bottomland Hardwood Forest
- Bottomland hardwood forest occurs on most sites within the floodplains and flats and in areas along river channels. Species commonly found in this type include water oak, willow oak, blackgum, American elm, overcup oak, green ash, deciduous holly (Ilex decidua Walt.), American holly (I. opaca Ait.), hawthorns, swamp privet (Foresteria accuminata (Michx.) Poir.), American hornbeam (Carpinus caroliniana Walt.), and occasionally palmetto (Sabal minor (Jacq.) Pers.). Many vines (Smilax spp., Vitis spp., Parthenocissus quinquefolia L. Planch, Rubus spp., Berchemia scandens (Hill) K. Koch, etc.) can be found in this type. Common grasses are longleaf chasmanthium (Chasmanthium latifolium (Michx.) Yates), wildrye (Elymus virginicus L.), cutgrass (Leersia lenticularis Michx. or L. oryzoides (L.) Sw.), switchgrass (Panicum virgatum L. and P. anceps Michx.), etc. Periodic inundation prevents the establishment of upland species and maintains the functioning of this vegetation type.
- Willow-Birch-Water Elm Forest
- The willow-birch-water elm type occurs along the river and creek channels, depressed areas, and at the confluence of lakes and creeks. This type exists in narrow strips rarely exceeding 100 meters in width. Other species coexisting in this type include river birch, cottonwood (Populus deltaoides Marsh.), red maple, water oak, sweetgum, pecan (Carya illinoensis (Wangehn.) K. Koch.), blackgum, water elm (Planeara aquatica J. G. Gmel.) , willow (Salix nigra Marsh. var. nigra), hawthornes, and American elm. Shrub, grasses and vines are similar to the bottomland hardwood type. This type may also include small swamp areas which are present in the study area but not significantly.
- Grassland/Crops
- These areas are dominated by grasses, graminoids (e.g. sedges and rushes),
and other herbaceous species. Some of these areas were once forested, but
were cut and converted to agricultural uses. This type includes pastures
and natural grasslands. Species with high abundance include little bluestem,
bluestems (Andropogon gerardii, A. ternarius, A. virginicus, A. glomeratus),
threeawns (Aristida spp.), Johnson grass (Sorghum halapense), eastern gammagrass
(Tripsacum dacctyloides), Bahia grass (Paspalum dialatum), Bermuda grass
(Cynodon dactylon), rushes (Juncus spp.) and sedges (Carex spp.).
Some of the grassland areas are well developed in the absence of grazing and other disturbances. This type also includes crop land which is irrigated and managed for production of grains, cotton, and other products. - Bare Ground/Soil
- These are the areas with no or very little vegetation coverage. Industrial parks, pavement, mineral mines, and plowed/fallow field are some examples. However, plowed/fallow agricultural fields classified as bare soils may be temporary.
- Water
- This includes water bodies impounded by small dams and in oxbow lakes, and open water in river channels with no or little vegetation cover overhead. Submersed aquatic vegetation may be present in some areas.
In Part two of this report, the mixed upland forest type is equivalent to the combination of pine-oak forest and oak-hickory forest types, and the mixed bottomland hardwood forest type is the combination of three types, hardwood-pine forest, bottomland hardwood forest, and willow-birch-water elm forest (Frye and Curtis 1990).
We also call these three types as bottomland forest, or forested wetlands, as they mostly occur in the floodplain and wet areas (Larson et al. 1981. Fish and Wildlife Service 1985). In the study area, there are small parcels of a mesic type (white oak mixed with other hardwood species) in moist slopes (Marks & Harcombe 1981), but not large enough to be classified as a separate type. This type is largely lumped with the oak-hickory type.
2. Analysis of Bottomland Areas to be Lost to the Proposed Waters Bluff Reservoir
The overall accuracy (total number of correctly classified groundtruth points divided by the total ground truthing points) for the classified land cover types is 83.1% based on about 250 collected ground truthing points (Table 1). The in-situ types in Table 1 are the land cover types identified in the field and the types in the first column is the corresponding types on the classified TM image. The percentage along the diagonal of Table 1 are the percentage of groundtruthing points correctly classified. Land cover types classified with high confidence include grassland/crops (96.7%), oak-hickory (100%), bottomland hardwood (91.2%), and oak-pine (81.6%). We did not collect enough samples for water, hardwood-pine, and bare ground/soil due to their limited and narrow distribution.
The area to be flooded is totaled at 31,018 acres (under average pool elevation of 300 ft.), of which, 68.2% (21,155 acres) is bottomland hardwood forest (Table 2). If willow-birch-water elm (704 acres) and hardwood-pine (3,072 acres) types are included, the total loss of bottomland forests will be 81.4%. In addition, 4,237 acres (13.7%) of grassland or pasture will be inundated as well. There are two large tracts of bottomland hardwood forest within the flooded area. One is between the US Highway 69 bridge and the Texas Highway 155 bridge and the other is between the Texas Highway 155 bridge and the US Highway 259 bridge. Most of the former is a continuous tract under the stewardship of Texas Parks and Wildlife Department (Old Sabine Bottom Wildlife Management Area) and the US Fish and Wildlife Service (Little Sandy Creek National Wildlife Refuge). The latter is not protected and shows fragmentation by pasture, plantation, and logging in some areas.
The quality assessment of and compensation calculation for these forests are addressed in Part 2 of this report.
Acknowledgments
We are grateful to Duane German for providing computer support and technical advice and Craig Scofield for GPS support. We also would like to thank Roy Frye of Wildlife Division for reviewing the manuscript and Joyce Gilliam for preparing the text layout.
References
Cowardin, L. M., Carter, V, Colet, F. C., and Laroe, E. T. 1979. Classification of wetlands and deepwater habitats of the United States. Fish and Wildlife Service, US Department of Interior, Washington D. C.
Dahl, T. E. and C. E. Johnson. 1991. Wetlands status and trends in the conterminous United States mid-1970's to mid-1980's: first update of the national wetlands status report. U.S. Fish and Wildlife Service, Department of Interior, Washington D. C.
ERDAS Inc. 1997. ERDAS Field Guide, 4th edition. Atlanta, Georgia.
Eyre, F. H. (editor). 1980. Forest cover types of the United States and Canada. Society of American Foresters, Washington D. C.
Fish and Wildlife Service. 1985. Texas bottomland hardwood preservation program -- final concept plan. U.S. Fish and Wildlife Service, Albuquerque, N.M.
Frye, R. G. and D. A. Curtis. 1990. Texas water and wildlife: an assessment of direct impacts to wildlife habitat from future water development projects. Austin, Texas.
Hefner, J. M., and J. D. Brown. 1985. Wetland trends in the southeastern United States. Wetlands 4:1-12.
Larson, J. S., M. S. Bedinger, C. F. Bryan, S. Brown, R. T. Huffman, E. L. Miller, D. G. Rhodes, and B. A. Touchet. 1981. Transition from wetlands to uplands in southeastern bottomland hardwood forests. pp. 225-273 in J. R. Clark and J. Benforado, eds. Wetlands of bottomland hardwood forests. Proceedings of a workshop on bottomland hardwood forest wetlands of the southeastern United States. Lake Lanier, Georgia.
Marks, P. L. and P. A. Harcombe. 1981. Forest vegetation of the Big Thicket, southeast Texas. Ecological Monographs 51:287-305.
McMahan, C. A., R. G. Frye, and K. L. Brown. 1984. The vegetation types of Texas including cropland. Texas Parks and Wildlife Department, Austin, Texas.
Tables and Maps
Map 1. Generalized Study Area at Proposed Waters Bluff Reservoir Site
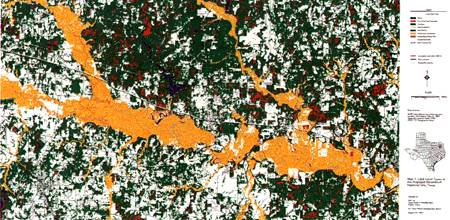
Map 2. Land Cover Types at Proposed Waters Bluff Reservoir Site and Vicinity
Part 2
Wildlife Habitat Quality Assessment for
the Proposed Waters Bluff Reservoir Site
Principal Investigators: Roy G. Frye, Kathy Boydston, Dr. Ray C. Telfair II
Introduction
The purpose of this study was to complete analyses to determine the quality of wildlife habitat for the vegetation cover types inventoried and mapped for the proposed Waters Bluff Reservoir. A separate vegetation inventory was completed as described in Part 1 of the report. Habitat quality information will assist the Texas Water Development Board with its water planning efforts. Work focused on Bottomland Hardwood Forests as these forests account for most of the vegetational coverage within the reservoir site, have been heavily impacted in Texas, and exhibit economic and ecological value. Activities were guided by provisions of Goal 2, Appendix A (Scope of Work), Texas Water Development Board (TWDB) Interagency Contract No. 97-483-226. This analysis was conducted by staff of the Wildlife Habitat Assessment Program, Wildlife Division, Texas Parks and Wildlife Department. The wildlife habitat assessment methodology detailed below uses vegetation cover types delineated from Part 1 as a basis for calculation of mitigation requirements. The bottomland hardwood forest and other land cover types in this study may occupy some of the same areas as federally delineated wetlands. Nevertheless, the location and areal information about bottomland hardwood forests and other cover types in this study cannot be used in place of a federal jurisdictional wetland delineation since these cover type definitions do not include consideration of hydric soils and hydroperiod information. Therefore, calculations for determining compensation requirements give only a preliminary estimate of the scale of mitigation that would be required if the reservoir were constructed.
Study Area
The Waters Bluff Reservoir site lies principally within the floodplain of the Sabine River in Wood, Smith, and Upshur Counties. The communities of Hawkins and Big Sandy are just to the north of the site, while the city of Gladewater is within proximity of the northeast lower portion of the site. The site is approximately 24 miles long with a width exceeding 2 miles in several locations. The extreme western portion of the site is located within the Post Oak Savannah ecological region, while the middle and eastern portions lie within the Pineywoods region as defined by Gould et al.(1960). Climate is subtropical, humid with warm summers and mild winters with occasional periods of sub-freezing temperatures. The average annual high temperature ranges between 75 and 76 degrees F, while the average annual low ranges between 51 and 53 degrees F. The average annual precipitation ranges from 40 to 46 inches. The average annual gross lake surface evaporation rate for this site generally ranges between 51 and 53 inches (Texas Department of Water Resources 1983).
Major vegetation cover types typical of this region have been previously mapped (McMahan et. al. 1984). These include Pine-Hardwood Forest, Willow Oak-Water Oak-Blackgum Forest, and native and/or introduced grasses. Within the broader category of Pine-Hardwood Forest, species such as loblolly pine, post oak, black hickory, eastern red cedar, hackberry, yaupon, and greenbriar commonly occur. This type is equivalent to the Mixed Upland Forest identified in Part 1 of this report. Floodplains and creek drainages are characterized by the Willow Oak-Water Oak- Blackgum association and may include other species such as overcup oak, elm, hackberry, sweetgum, willow, hawthorn, greenbriar, and water elm. This reservoir site contributes approximately 10% of the total acreage of bottomland hardwood forests occurring within the Sabine River floodplain, while the floodplain forests comprise about 22% of the remaining acreage within the major river bottoms in East Texas (Frye 1986). Cover types occurring but comprising disproportionately small acreage include pine plantations and cropland. Native and introduced grasses are generally associated with pastures, hayfields, and areas adjacent to developed urban or rural areas.
Methods
The overall quality of the occurring habitat for wildlife resources was evaluated for the Waters Bluff Reservoir Site using the wildlife habitat appraisal procedure (WHAP) (Appendix 1). The technique measures key components which contribute to the ecological condition of the classified cover types within each reservoir site and resulting overall suitability for wildlife. Habitat quality values obtained from site evaluation criteria are combined with acreage figures for each cover type to provide available Habitat Units (HU).
The method is based on the following assumptions:
- that vegetative structure including species composition and physiognomy is itself sufficient to define the habitat suitability for wildlife;
- that a positive relationship exists between vegetation diversity and wildlife species diversity.
- that vegetation composition and primary productivity directly influence population densities of wildlife species.
Habitat quality scores for each cover type represent baseline conditions. The total HU's lost are numerical values that quantify initial direct impacts of reservoir construction, and to assist comparison with other projects, assume complete loss of existing vegetation cover below the proposed normal pool elevations. These numbers do not reflect annualized losses calculated over the life of the project nor account for any potential habitat gains that could be created as a result of reservoir construction. Consequently, the compensation estimates may not be the same as estimates calculated in future site specific evaluations. Other factors which can influence these differences include changes in project assumptions, variations in project design, land use changes, and priorities for certain habitat types. The compensation estimates calculated for this report are intended to provide preliminary data in a format to allow comparison of reservoir site alternatives. The estimates only address direct impacts. Long term indirect impacts such as increased land use change around the proximity of the reservoirs, or any changes to vegetation composition and quality below the dams from altered instream flow are not included in this assessment.
Compensation requirements for each of the impacted cover types were calculated according to three hypothetical values representing proportional amounts (25%, 50%, and 100%) of the total potential gain in habitat quality of a compensation area which could be obtained with management. Raising the potential gain in habitat quality of a compensation area by 25% assumes relatively minimal management; an increase of 50% assumes moderate management; while achieving 100% of the potential gain assumes intensive management.
Minimal management could include marking wildlife management area boundaries, providing protection by periodic surveillance, incorporating grazing control and allowing the habitat quality to increase through natural succession. Annual estimated costs per acre for this level of management would be lower than moderate to higher management. Moderate management might include the above measures with the addition of some selected herbaceous seedings and limited vegetation manipulation through controlled burning, disking, thinning, or other means. Costs for this level would be higher than minimal management, but lower than intensive management. Intensive management would include the above measures with the addition of significant efforts to reestablish communities of grasses, forbs, woody shrubs or trees through supplemental plantings and vegetation maintenance; establishing indices of relative abundance of wildlife species and conducting research associated with wildlife needs. Annual costs for this level would involve highest funding expenditures. All three levels of management would likely include wildlife-oriented public recreational use.
All cover types evaluated for habitat quality were also classified into resource categories to denote mitigation planning goals. Such goals will be pursued by the U.S. Fish and Wildlife Service within the Federal permitting process and TPWD during the review of state water use permit applications and formulation of recommendations to the Texas Natural Resource Conservation Commission (TNRCC). A description of each resource category, designation criteria, and mitigation planning goals are provided in Table 1.
| Resource Category | Designation Criteria | Resource Planning Goal |
|---|---|---|
| 1 | High value for evaluation species or habitat, unique or irreplaceable. | No loss of habitat value. |
| 2 | High value for evaluation species or habitats and scarce or becoming scarce. | No net loss of in-kind habitat value. |
| 3 | High to medium value for evaluation species or habitats and commonly occurs. | No net loss of habitat value while minimizing loss of in-kind habitat value. |
| 4 | Medium to low value for evaluation species or habitats. | Minimize loss of habitat value. |
Field evaluation forms used to rate the existing cover types within the two reservoir sites are provided in Appendix 2.
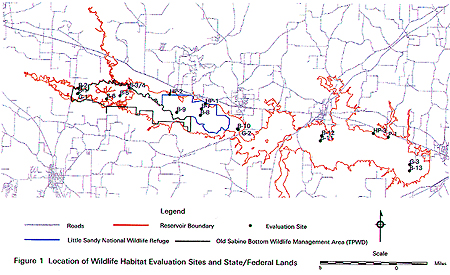
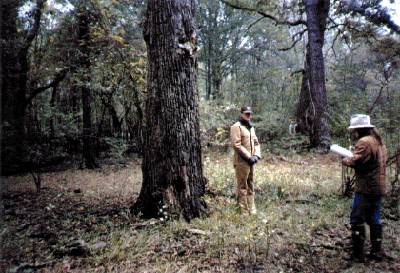
Field data collection required the completion of vegetation cover maps from Part 1 to allow precise location of data collection sites. Such data was not available until the first week of November, 1997. Field sampling was curtailed by extensive rainfall during the week of November 10 which hampered data collection efforts. However, a total of 20 individual sites were evaluated during the period November 10-11, 1997. The location of each site in relation to the approximate normal reservoir pool level is provided as Figure 1. Site assessments were performed by Kathy Boydston, Dr. Ray C. Telfair, II, Larry D. LeBeau, Greg Creacy, and Roy G. Frye, Wildlife Division, Texas Parks and Wildlife Department. Evaluations were conducted throughout the reservoir site as indicated by Figure 1. This included private land within the reservoir site, the Old Sabine Bottom Wildlife Management Area, and the Little Sandy National Wildlife Refuge (NWR). Existing knowledge of the general area within the reservoir site indicated that a wide variety of habitat quality existed, varying according to specific site and existing land use. The data collection efforts were structured to achieve representation throughout the reservoir site and not focus on any particular area. Results of the vegetation cover inventory in Part 1 indicated delineation of a total of 9 cover types. For the purposes of collecting field data for the Wildlife Habitat Appraisal these nine cover types were grouped as illustrated in Table 2. Note that three thematic classes were lumped into a larger mixed bottomland hardwood forest category. This included a class designated as Hardwood - Pine Forest. As discussed in Part 1, the class typifies a community characterized by mixed hardwood tree species occurring with loblolly pine located on higher, more well drained floodplain sites and is considered a bottomland hardwood type by many authorities (Eyer 1980), (FWS 1985), and (Larson, et. al l981).
| No. of Sites Evaluated | Combined Class Name (Original Mapped Name) |
Acres |
|---|---|---|
| 13 | Mixed Bottomland Hardwood Forest (Hardwood-Pine Forest) (Bottomland Hardwood Forest) (Willow-Birch-Water Elm Forest) |
24,931 (3,072) (21,155) (704) |
| 3 | Mixed Upland Forest (Pine - Oak Forest) (Oak-Hickory Forest) |
1,091 (241) (850) |
| 3 | Grassland/Crops | 4,237 |
| 1 | Pine Plantation | 559 |
| 0 | Other (Water, Bare Ground, soil) | 200 |
The approximate location of sites was determined in advance of the field work to save time. This allowed for the contacting of landowners to obtain permission to access property and to assure sites adequately represented delineated cover types. Sites were also selected based on road accessibility. In all cases, investigators selected specific sites a sufficient distance from the access road to be removed from the influence of rights-of-way, easements, and fence lines. Site locations were recorded using global positioning instrumentation which was downloaded into a Department PC and subsequently plotted (Figure 1).
Proposed actions normally require mitigation measures that 1)minimize the impact by changing the project location, design, or operational plan; 2) rectify the impact by repairing or rehabilitating the affected environment; 3) reduce or eliminate the impact over time; and 4) compensate for any net wildlife losses created as a result of the impact. While the first three measures apply to reducing net losses, the latter provides a means for replacing resource losses that cannot be minimized or avoided.
The concept of compensation is based on the principle that wildlife resources are renewable and thus can be replenished through acquisition and management of suitable land. Habitat impacts and compensation credit may be quantified using habitat units (HUs). Habitat Units are calculated by multiplying habitat quality (HQ) by habitat quantity (acres of habitat). A tract of land has an existing inherent habitat value. To receive compensation credit, the land must be managed to increase its carrying capacity (as measured by HQ) so it can maintain existing wildlife populations while concurrently supporting additional populations to make up for the wildlife lost as a result of the project impacts. Management may be through physical modifications or treatments to improve the habitat or passive protection from disturbances, thus allowing natural succession. In either case, to obtain gains in habitat value for compensation from an acre of habitat, that acre must be managed to increase its existing habitat quality.
Figure 1. Location of Habitat Evaluation Data Collection Sites.
The formulas for determining acreage requirements to compensate for habitat losses are as follows:
Compensation acres needed = HUs lost from project ÷ Potential HQ Gain
Potential HQ Gain = Maximum HQ value for habitat type - Existing baseline HQ
For this analysis, it is assumed that the maximum HQ value obtained through management will be the maximum HQ score possible for the cover type. The maximum HQ score for Forests is 1.0, the highest possible HQ for grasslands/crops is 0.92. Obtaining the maximum potential HQ gain also assumes maximum (intensive) management. Compensation requirements were also calculated for the options of achieving 50% and 25% of the potential maximum HQ gain, implying moderate and minimum levels of management, respectively.
The above formulas can be applied very simply. If 10 acres of wildlife habitat with a habitat quality score of 0.6 were inundated by a reservoir, a total of 6 HUs would be lost [10 (acres) x 0.6 (HQ) = 6 (HUs)]. Full compensation to offset this loss would require an increase in habitat value of 6 HUs. If another 10 acres with an existing HQ of 0.6 were acquired, no compensation credit occurs because no increase in habitat value occurs over existing conditions. However, if by employment of habitat improvement measures, the existing habitat with an HQ score of 0.6 is increased by 0.4 to its maximum value of 1.0, then 15 acres would fully compensate [6 (HUs lost ÷ 0.4 (HQ increase) = 15 (compensation acres)]. If the existing HQ of the mitigation tract is only slightly raised through management to 0.7, then 60 acres would be required to fully compensate for the losses [6 HUs ÷ 0.1 (HQ increase) = 60 (compensation acres)]. These examples illustrate that compensation acreage can become significantly higher as the potential gain in habitat quality decreases. A summary of the Habitat Quality (HQ) assessment and compensation requirements is provided in Table 3.
Results and Discussion
Wildlife habitat appraisals were conducted for four cover types within the Waters Bluff Reservoir Site as identified in Table 2. Tabulated data is contained within Table 3. This information includes the name of the cover type evaluated, resource category of the cover type (in parenthesis following the cover type name), acres impacted within normal pool elevation, habitat quality rating obtained by field evaluation, habitat units lost, hypothetical management options, potential gain in habitat quality, and compensation requirements for each management option. Mitigation goals for habitat losses can be obtained by noting the resource category designation after the cover type name and referencing Table 1.
| Cover Type/Resource Category ( ) | Acres Inventoried | Habitat Quality Value | Habitat Units Lost | Management Option | Potential Habitat Quality Gain | Compensation Requirements (Acres) | ||
|---|---|---|---|---|---|---|---|---|
| Mixed Bottomland Hardwood Forest (1 and 2)* | 24,931 | 0.84 | 20,942 | Minimum 25% |
.040 .080 .160 |
523,550 | 261,775 |
130,888 |
| Mixed Upland Forest (2 and 3) |
1,091 | 0.75 | 818 | Minimum 25% Moderate 50% Maximum 100% |
.063 .125 .250 |
12,984 | 6,544 |
3,272 |
| Grassland/Crops (3 and 4) |
4,237 | 0.57 | 2,415 | Minimum 25% Moderate 50% Maximum 100% |
.088 .175 .350 |
27,443 | 13,800 |
6,900 |
| Pine Plantation (4) |
559 | 0.48 | 268 | Minimum 25% Moderate 50% Maximum 100% |
.130 .260 .520 |
2,062 | 1,031 |
515 |
| Other | 200 | |||||||
| Total | 31,018 | Minimum 25% Moderate 50% Maximum 100% |
566,039 | 283,150 |
141,575 |
|||
The total area inundated by Waters Bluff Reservoir at the proposed normal pool elevation is 31,018 acres. Mixed bottomland hardwood forests comprise 24,931 acres or 80% of the total area. Similar analyses using the WHAP appraisal technique and the HEP (Habitat Evaluation Procedure developed by the U.S. Fish and Wildlife Service) have been previously investigated (Frye and Curtis 1990) for 44 other reservoirs. In the 1990 study, HSI values obtained for particular wildlife species on previously conducted HEP evaluations were averaged for all the species occupying each cover type to provide numerical values compatible with WHAP. Data for this reservoir site was compared with information compiled for other reservoirs. With an average habitat quality rating of 0.84 the site ranks equally high in habitat quality with the Lindenau reservoir site in south central Texas, but has much more bottomland acreage than the 3,054 acres at Lindenau. In addition, the highest recorded individual habitat quality score (0.98) among all reservoirs was collected at the Waters Bluff site on the Little Sandy National Wildlife Refuge.
The influence of existing high habitat quality in calculating compensation requirements is significant. Assuming bottomland hardwood tracts of sufficient size exist and could be purchased from willing sellers, acquisition and intensive management of 130,888 acres would be required to fully compensate for in-kind losses. This represents 5.25 acres of replacement for each acre of bottomland forest impacted. For the entire reservoir project, 141,575 acres would be required to fully compensate for the loss of 30,818 acres of existing vegetation cover types or replacement of 4.59 acres for each acre lost. It is uncertain whether one or even several mitigation tracts could be found that could satisfactorily meet these mitigation requirements.
Planning Issues
Bottomland hardwood forests in Texas have been documented to contain at least 189 species of trees and shrubs, 42 woody vines, 75 grasses, and 802 herbaceous plants. This results in a food web that supports 116 species of fish, 31 species of amphibians, 54 species of reptiles, 273 species of birds, and 45 species of mammals. Many of these species would be expected to occur within the Waters Bluff Reservoir site, due to existing high vegetation species diversity and the presence of old growth forests.
Eastern Wild Turkeys have suffered major declines but are now increasing, partly through expensive releases the Department has completed at several locations within the reservoir site as part of its Eastern Wild Turkey Restoration Project. Loss of these established turkey populations will require additional compensation considerations.
Seventy-four species of threatened or endangered animals depend directly on bottomland forest systems. Bottomlands within the Waters Bluff reservoir site provide habitat for a number of rare species. Two rare species of bats, the southeastern myotis (Myotis austroriparius) and Rafinesque big-eared bat (Corynorhinus rafinesquii) occur as far west as the bottomland hardwood forests of east Texas. Declines in populations throughout other parts of their range due to disturbance and habitat loss make it imperative that habitat be protected in Texas. One maternity tree roost of the southeastern myotis has been confirmed (Photo 1) with another suspected on the Little Sandy NWR. Another maternity tree roost has been confirmed farther downstream. In addition, several winter tree roosts have been discovered and continue to be monitored along the Sabine River corridor. It appears that these species prefer tree roosts in very large live bottomland hardwood trees where the base has been hollowed out. A disruption of this natural system could decrease available roost sites, and thus contribute to the further decline of this species.
Photo 1. Maternity Roost Tree of the Southeastern Myotis on the Little Sandy NWR.
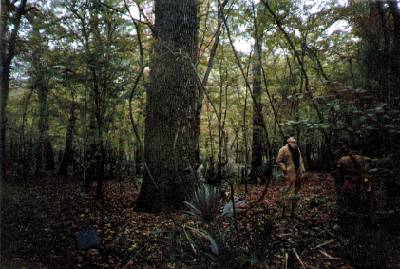
Several tracts of particular sensitivity and importance lie within the reservoir site. These tracts were acquired by public conservation agencies for the express purpose of conserving bottomland hardwood forests and associated wetlands. The previously mentioned Little Sandy NWR is one of the few bottomland hardwood forest sites remaining in Texas (Figure 1). It contains 5 state champion trees and is of importance to many species of wildlife, especially thousands of wintering waterfowl. The refuge benefits the public by protecting and preserving forests of national value and importance. Old growth timber occurring on this site is illustrated by photo 2. Photo 3 illustrates old growth forest occurring on private land within the reservoir site.
Photo 2. Old Growth Bottomland Hardwood Forest on the
Little Sandy National Wildlife Refuge.
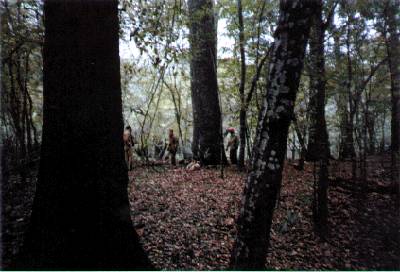
Photo 3. Old Growth Bottomland Hardwood Forest occurring
on private land within the reservoir site. Note cavities used by many species
of wildlife for nesting and escape cover. Trees must reach mature or old growth
stages before cavities commonly occur.
In addition to the ecological importance of the Little Sandy NWR, the Texas Parks and Wildlife Department's 5,158-acre Old Sabine Bottom Wildlife Management Area, which lies directly across the river from the Little Sandy NWR, has both ecological and mitigation values. A total of 2,694 acres was initially purchased by TPWD. An additional 2,464 acres of land was purchased by the Texas Department of Transportation. Lands acquired by TxDOT were transferred to Texas Parks and Wildlife for wildlife management purposes to provide future mitigation credits that can be used by TxDOT to offset wetland losses incurred by a number of planned highway projects in northeast Texas. Total initial investment by TPWD and TxDOT was 2.7 million dollars. This Department, TxDOT, Texas Natural Resources Conservation Commission, Corps of Engineers, Environmental Protection Agency, and the U.S. Fish and Wildlife Service worked cooperatively to establish this mitigation area with the intent of simultaneously conserving an important natural resource while addressing the requirements of a number of federal laws. TxDOT has also recently spent over 200 thousand dollars to upgrade existing roads on the area.
If it were constructed, the Waters Bluff Reservoir project would cover approximately 75% of the Old Sabine Bottom Wildlife Management area (Figure 1). Mitigation would be complicated since part of the area is already a mitigation site that is dedicated to compensating for other areas that have been altered or destroyed.
The high habitat values and level of impact expected from reservoir inundation will require substantial acquisition and management of forested wetland under any of the mitigation options.
Appendix
1
Wildlife Habitat Appraisal
Biological Habitat Components – Evaluation Key
Component 1 – Site potential
Evaluate for all cover types.
| Criteria | Value |
|---|---|
| Substrate is composed or exhibits one or more of the following: 1) at least periodically supports predominately hydrophytic vegetation; 2) is predominately undrained hydric soil and supports or is capable of supporting hydrophytic vegetation 3) is saturated with water or covered by shallow water during 1-2 months during the growing season of each year (swamps, bogs, marches, and hardwood bottomlands exhibiting a high frequency of flooding). |
25 |
| Alluvial substrate although less hydric than above; only temporarily or intermittently inundated or saturated for short periods (higher terraces of hard-wood bottoms, riparian drainages). | 20 |
| Uplands with thick surface layer (generally greater than or equal to 10 inches) consisting of unrestricted loam (including sandy loam) or dark well structured (granulated) clay (including sandy clay). | 12 |
| Uplands with shallow surface layer (generally less than 10 inches) consisting of shallow soil over restrictive layer (rock, gravel, claypan, etc.) or deep, leached, droughty sand or, relative light colored, poorly structured clay or gravelly/stony sand or clay. | 7 |
| Organic matter minimal or absent at the surface. (Includes undrained or saturated hydric soils not supporting vegetation, i.e., mud flats). | 3 |
| Surface contains chemical compounds which would potentially limit growth of primary producers (salt, mine overburden containing heavy metald or acid compounds, surface pollution). | 1 |
Component 2 – Temporal Development of Existing Successional Stage
Determine currently existing successional stage (Criteria A); evaluate for all cover types except marshes. For this habitat type use Criteria B Criteria A3/ Value
| Criteria A | Value |
|---|---|
| Old timber (100 or more years, trees>25 inches)* | 20 |
| Mature timber, old brush, climax prairie (40-99 years, trees 12-25 inches) | 12 |
| Pole and young timer, mature brush (11-39 years, trees <12 inches) | 6 |
| Grasslands in grazing disclimax** or early and mid-successional perennial grasses and forbs, hay meadows | 5 |
| Seedlings, saplings, young brush (3-10 years | 3 |
| Annual native or introduced grasses, forbs, crops | 1 |
* Diameter at breast height (DBH)
** Example: Texas winter-grass-silver bluestem grasslands
Component 2 – Temporal Development of Existing Successional Stage
Criteria B Value
(Marsh wetlands)
| Criteria B | Value |
|---|---|
| Established mature communities within or adjacent to an enclosed coastal water body with a free connection to the sea and a measurable quantity of salt in its waters but with abundant or semi-abundant freshwater influx (estuarine areas). | 20 |
| Established mature communities or intermediate to well advanced successional stages occurring in fres, brackish, or sale environments; freshwater inflow limited to generally small tributaries and localized runoff or overflow from flood conditions. | 10 |
| Aquatic or semi-aquatic communities occurring in generally early to intermediate successional stages as a result of periodic changes in moisture gradients; highly dependent on seasonal weather conditions. | 5 |
Component 3 – Uniqueness and Relative Abundance
1. Evaluate the habitat within the site according to the categories below.
| Category | Value |
|---|---|
| Highly valuable for wildlife and is very uncommon, unique or irreplaceable (USFWS Mitigation Resource Category 1) | 20 |
| Highly valuable for wildlife but is relative scarce or becoming scarce (USFWS Mitigation Resource Category 2) | 15 |
| Exhibits high to medium value for wildlife and is relative abundant (USFWS Mitigation Resource Category 3) | 10 |
| Exhibits medium to low value for wildlife and is relatively abundant (USFWS Mitigation Resource Category 4) | 5 |
| Exhibits very low wildlife value regardless of abundance or scarcity | 0 |
*Corresponds to scarcity and abundance criteria as contained in U.S. Fish and Wildlife Service Mitigation Policy; Federal Register Vol. 46:15, Jan. 23, 1981.
Component 4 - Vegetation Species Diversity
Criteria A
Diversity of Woody Species
Evaluate the composition of readily observable woody species in the overstory, midstory, and understory by determining the number of species groups as represented by the following categories. Evaluate for all cover types except Swamps (Criteria C) and Marsh wetlands (Criteria D). Worksheet for Criteria A&B provided on page 25.
| Species Group | Examples |
|---|---|
| Berry/Drupe | hackberry, mulberry, paw paw, hawthorn, winterberry, black haw, soapberry, persimmon, choke cherry, yaupon, dogwood, Am. beautyberry, greenbriar, dewberry, poison ivy, rattan vine, blackgum, grape, mulberry, holly, juniper, bumelia, huckleberry, sumac, Virginia creeper, sassafras, Prickly ash, chinaberry, crab apple, agarito, lotebush, ivy tree vine |
| Legume/Pod | mesquite, locust, redbud, Acacia spp. |
| Acorn | white oak, red oak, live oak, water oak, willow oak, post oak, bur oak |
| Nut/Nutlike | hickory, pecan, walnut, wax myrtle, ironwood, ephidra |
| Samara (Winged Fruit | elm, ash, box elder, maple, river birch |
| Cone | pine, cyprus |
| Achene | sycamore, baccharis spp., sandsage, Clematis spp., salt bush |
| All others (Capsules, Follicles, Burrs, Hairy seeds) | willow, cottonwood, sweetgum, salt cedar, yucca, cactus, bottonbush, sweetgum, bois d'arc, creosotebrush |
Value assigned is equivalent to the number of groups represented (Maximum=8, If none is represented then value is 0)
Component 4 – Vegetation Species Diversity Criteria B
Total Number of Occurring Woody Species
Determine the total number of readily observable woody species and assign value
according to the following categories. Do not use for Swamps (Criteria C) or
Marsh wetlands (Criteria D)
| Criteria B | Value |
|---|---|
| 15 or more species | 7 |
| 10-14 species | 5 |
| 5-9 species | 3 |
| 1-4 species | 1 |
| None occurring | 0 |
Component 4 – Vegetation Species Diversity – Criteria C
Diversity of Vegetation in Swamps
Evaluate swamp areas according to the following
categories:5/
| Criteria D | Value |
|---|---|
| Seasonally flooded mixed bottomland hardwoods; inundation resulting from freshwater inflow | 15 |
| Seasonally flooded vegetation dominated by cypress-tupelo; inundation resulting from freshwater inflow | 10 |
| Continually flooded or infrequent, abrasively flooded vegetation comprised of one or more species; inundation resulting from freshwater, brackish or saline inflow | 6 |
| Continually flooded vegetation; inundation resulting from stagnant or impounded freshwater, brackish, or saline water conditions | 2 |
Component 4 – Vegetation Species Diversity – Criteria D
Diversity of Vegetation in Marshes and other similar wetland areas
Determine the major types of wetland vegetation
present according to the following categories: rooted emergent vegetation,
rooted submergent vegetation, rooted vegetation with floating leaves, algal
mat communities (microalgae), benthic or drifting seaweeds (macroalgae).
| Criteria D | Value |
|---|---|
| High – includes three or more of above categories. | 20 |
| Medium – includes two of the above categories. | 15 |
| Low – includes one of the above categories. | 5 |
Component 5 – Vertical Vegetation Stratification
Evaluate canopy coverage of the following three categories of vegetation for all cover types except crops and marsh wetlands.
Categories:
1) Vegetation greater than 12 feet high
2) Vegetation 3-12 feet high
3) Vegetation less than 3 feet high
| Criteria | Value |
|---|---|
| All three categories present, each accounting for at least 25 percent of ground cover | 5 |
| Any two of the above categories present, each accounting for at least 25 percent of ground cover | 4 |
| Only one of the above categories presend and accounting for at least 25 percent of ground cover | 3 |
| None of the categories together account for more than 25 percent of ground cover | 1 |
Component 6 – Additional Structural Diversity Components
Evaluate for all cover types except crops. Determine the presence of brush piles, rock piles, rocky crevices, snags, fallen logs, thick grass cover, brambles or thickets according to the following categories.
| Criteria | Value |
|---|---|
| Abundant – Three or more of the above components readily apparent and observable from most locations with the site | 5 |
| Moderate – Any of the above components present, and observable with very little search effort | 3 |
| Sparse – Any of the above components present, but occurring infrequently or requiring significant search effort to locate | 1 |
| Absent – None of the above components observed | 0 |
Component 7 – Condition of Existing Vegetation – Other
Use: Criteria A & B for cover types (other
than crops and marsh wetlands) containing woody and/or herbaceous vegetation.
Criteria C for cropland only.
Criteria D for marsh wetlands.
Criteria A
Degree of utilization of woody vegetation by vertebrates and invertebrates
| Criteria A | Value |
|---|---|
| Not evident – little or no evidence of plant utilization | 5 |
| Moderate – plant utilization observable with minimal damage to leaves and/or stems | 3 |
| Severe – damage to leaves and/or stems readily observable | 1 |
| No woody vegetation present | 0 |
Criteria B Value
Availability of Herbaceous Vegetation.
Do not evaluate for Crops (Criteria C) or Marsh Wetlands (Criteria D)
| Criteria B | Value |
|---|---|
| Good – Eight or more combined species of grasses and forbs readily observable. | 5 |
| Fair – Four to seven combined species of grasses and forbs readily observable | 3 |
| Poor – One to three combined species of grasses and forbs readily observable | 12 |
| None – Herbaceous vegetation lacking or absent | 0 |
Criteria C Value
Available Biomass (Evaluate for croplands only)
| Criteria C | Value |
|---|---|
| High – biomass removed periodically, although not necessarily annually; removed biomass supplanted by other vegetation resulting from natural succession of invading species or overseeding of introduced species; (ex. Rice or other crop on multi-year rotational system allowing for additional biomass accumulations between harvests). | 10 |
| Moderate – Most biomass removed annually or semi-annually but with some residual amount remaining during portions of the rotational period. Minimal bare ground conditions (Hay operations, crops grown for pasture or grazing, chiseled crops). | 5 |
| Low – Most biomass removed annually due to clean farming practices creating significant bare ground conditions (intensive row crop farming). | 1 |
Criteria D Value
Condition of Marsh Wetlands
| Criteria D | Value |
|---|---|
| Unaltered – Quality of water and/or associated vegetation good, no foreseeable danger of environmental intrusion including pollution, contamination, sedimentation, or stagnation | 10 |
| Stable – Quality of water and/or associated vegetation good, although evidence exists that pollution, contamination sedimentation or stagnation could occur in the future or has occurred in the past | 5 |
| Degraded – Quality of water and/or associated vegetation poor or declining or degradation imminent | 1 |
Literature Cited
Eyre, F.H. (ed). 1980. Forest cover types of the United States and Canada. Soc. Am. Foresters, Washington D.C. 146 pp.
Frye, R.G. 1986. Bottomland hardwoods-current supply, status, habitat quality and future impacts from reservoirs. In McMahan, C.A., and R.G. Frye, eds. Bottomland Hardwoods in Texas - Proceedings of an Interagency Workshop on Status and Ecology, May 6-7, l986. Tex. Parks and Wildl. Dep. Pub. PWD-7100-133-3/87. pp. 24-27.
Frye, R.G. and D.A. Curtis. 1990. Texas water and wildlife- an assessment of direct impacts to wildlife habitat from future water development projects. Tex. Parks and Wildl. Dep. Pub. PWD-BK-7100-147-5/90.
Gould, F.W., G.O. Hoffman, and C.A. Rechenthin. 1960. Vegetational areas of Texas. Tex. A&M Univ., Tex. Agric. Exp. Sta. Leaflet 492.
Larkin, T.J., and G.W. Bomar. 1983. Climatic atlas of Texas. Tex. Dep. Water Res. LP-192, 149p.
Larson, J.S., M.S. Bedinger, C.F. Bryan, S. Brown, R.T. Huffman, E.L. Miller, D.G. Rhodes, and B. A. Touchet. 1981. Transition from wetlands to uplands in southeastern bottomland hardwood forests. P. 225-273 in J.R. Clark and J. Benforado, eds. Wetlands of Bottomland Hardwood Forests. Proceeding of a Workshop on Bottomland Hardwood Forest Wetlands of the Southeastern United States. Lake Lanier, Georgia, June 1-5, 1980. Developments in Agriculture and Manage-Forest Ecology, Vol. 11. Elsevier Scientific Publishing Co. New York.
McMahan, C.A., R.G. Frye, and K.L. Brown. 1984. The vegetation types of Texas including cropland. Tex. Parks and Wildl. Dep. Bull. 700-120, 40 p.
U.S. Fish and Wildlife Service. L985. Texas bottomland hardwood preservation program -final concept plan. U.S. Fish and Wildlife Service. Albuquerque, N.M. 378 pp.
TWDB Comments on TPWD Draft Report:
Analysis of Bottomland Hardwood Areas and Assessment of Wildlife Habitat Quality at the Potential Future Waters Bluff Reservoir Site
(TWDB CONTRACT NO. 97-483-226)
All tasks in the contract scope of work have been addressed. A few specific comments are detailed below and should be considered in preparing the Final Report for submittal to the Texas Water Development Board. Overall, the draft report supplies data and information that meets or exceeds the contract requirements.
Part One, page one, Introduction:
Several federal agencies recognize a wetland type called "bottomland hardwood forest." When this type of wetland is altered or destroyed by construction of a water development project, mitigation is required and may involve compensatory land acquisition to make up for the wetland loss. The exact area that will require mitigation is determined through a federal delineation of the wetlands, which employs three major criteria – the vegetation present, the hydroperiod of the area, and the presence of hydric soils. However, the draft report also recognizes a land cover type called "bottomland hardwood forest," which is based only on a vegetation analysis using satellite imagery, aerial photography, and ground-truthing selected sites. Since no hydroperiod or hydric soils information was used in TPWD's determination, a clarifying statement should be included in the report's Introduction which explains to readers that bottomland hardwood forest areas identified in the report are not exactly the same as those that might be identified using the federal delineation procedures.
Part One, page 9, line 3:
The contents of Table 1 could use a little more explanation. It was not clear to some reviewers which axis in the table represents the classified image (horizontal axis?) and which axis represents the ground-truth determination (vertical axis?). In addition, please include a brief description of how the overall 83.1% accuracy was calculated.
Part Two, page 1, line 4:
Add the word "Board" after the words "Texas Water Development."
Part Two, page 2, line 3:
Note that Appendix 1 and Appendix 2 were not included in the review copy of the draft report; therefore, TWDB requests copies of the appendices to review before the report is finalized.
Part Two, page 4, line 11:
There seems to be a font problem with the word "Area."
Part Two, page 8, line 11:
The text refers to a tree roost for the "southereastern" myotis, but the caption on Photo 1 refers to the "eastern" myotis. Shouldn't these common names be the same?
Top of Page^